Q1 2026 Snapshot — Prices Cooling, Rent Burden Persistent
FHFA's quarterly state HPI (COSTHPI) registered roughly −2.4% year-over-year in Q1 2026 for Colorado — among the largest declines in the country and the first sustained statewide retracement since the 2020 run-up. Rent pressure has not eased in step: NLIHC's 2025 Out of Reach report puts the Colorado statewide two-bedroom Fair Market Rent at $1,913/month, with a two-bedroom housing wage of $36.79/hr — well above what minimum-wage or many service-sector earners can sustain without cost burden. Read the county-level analysis below against this backdrop: price declines are easing the for-sale market faster than they are easing rents.
Sources: FHFA Quarterly HPI (COSTHPI, FRED); NLIHC Out of Reach 2025.
Across all 64 Colorado counties, housing costs have risen faster than household incomes over the past decade. This analysis integrates ACS 5-year estimates, FHFA House Price Index data, BLS Producer Price Index construction inputs, QCEW construction wages, and Census Building Permit data to surface the structural drivers of affordability stress at the county level.
Key Findings
- Median Gross Rent (ACS 2020–2024, B25064): Statewide median of $1,412/month, up ~28% from the 2010–2014 cohort
- Rent Burden ≥30% of income (ACS 2020–2024, B25070): 47% of renter households statewide; highest in resort and rural counties
- FHFA HPI 10-Year Change (2014–2024): Statewide average appreciation of 112%, far outpacing income growth
- Construction Wages (QCEW NAICS 23, 2014–2024): Wages grew 31% over the same period, a significant component of cost pressure
- Top Driver of HPI Change: Permit issuance per capita emerged as the strongest predictor in the ElasticNetCV model, followed by income growth and rent burden
Sources: U.S. Census Bureau ACS 5-year estimates (table IDs shown above) · FHFA House Price Index · BLS QCEW construction wages. Verify specific figures against the underlying tables before citing.
Margin of Error (MOE) Caution: ACS 5-year estimates carry margins of error that can be substantial for small-population counties (fewer than 5,000 residents). County-level comparisons should be interpreted with caution. All point estimates are the ACS published median; confidence intervals are ±1 MOE. Where the coefficient of variation exceeds 15%, figures are flagged as unreliable.
Interactive County Maps
Maps are generated monthly from the Python pipeline and embedded below. If a map file is not yet available (first run), a placeholder is shown. Use the pipeline script to regenerate: python scripts/build_co_housing_costs_insight.py --refresh.
Current Housing Cost Indicators (2020–2024 ACS)
Median Gross Rent by County
This choropleth map shows median gross rent across all 64 Colorado counties using 2020–2024 ACS 5-year estimates. Darker shades indicate higher median rents. Resort counties such as Pitkin, Eagle, and Summit show the highest rents.
Rent Burden (Share of Renters Paying ≥30% of Income)
This map shows the share of renter households spending 30 percent or more of household income on gross rent. Higher values indicate greater affordability stress.
Vacancy Rate by County
This map displays the housing vacancy rate across Colorado counties. Low vacancy in urban and resort markets contributes to upward rent pressure.
10-Year and 15-Year Windowed Change
Using non-overlapping ACS 5-year cohorts — 2020–2024 (current), 2010–2014 (10-year baseline), and 2005–2009 (15-year baseline) — we calculate the proportional change in median gross rent between endpoints.
Rent Change: 10-Year Window (2014 → 2024 Cohorts)
This map shows proportional change in median gross rent between the 2010–2014 and 2020–2024 ACS 5-year cohorts. Counties with the highest growth are those with strong population in-migration and limited housing supply.
Rent Change: 15-Year Window (2009 → 2024 Cohorts)
15-year rent change captures the long-run trajectory from the pre-recession period through the post-pandemic era. Mountain resort counties show the highest long-run appreciation.
FHFA House Price Index Appreciation
The FHFA All-Transactions House Price Index (county-level) measures home price appreciation using repeat-sales methodology, independent of ACS surveys.
FHFA HPI 10-Year Change by County
FHFA HPI 10-year change highlights which counties have seen the greatest home price appreciation over the past decade, using repeat-sales methodology. Front Range urban counties and mountain resort counties lead in appreciation.
Construction & Development Cost Pressure
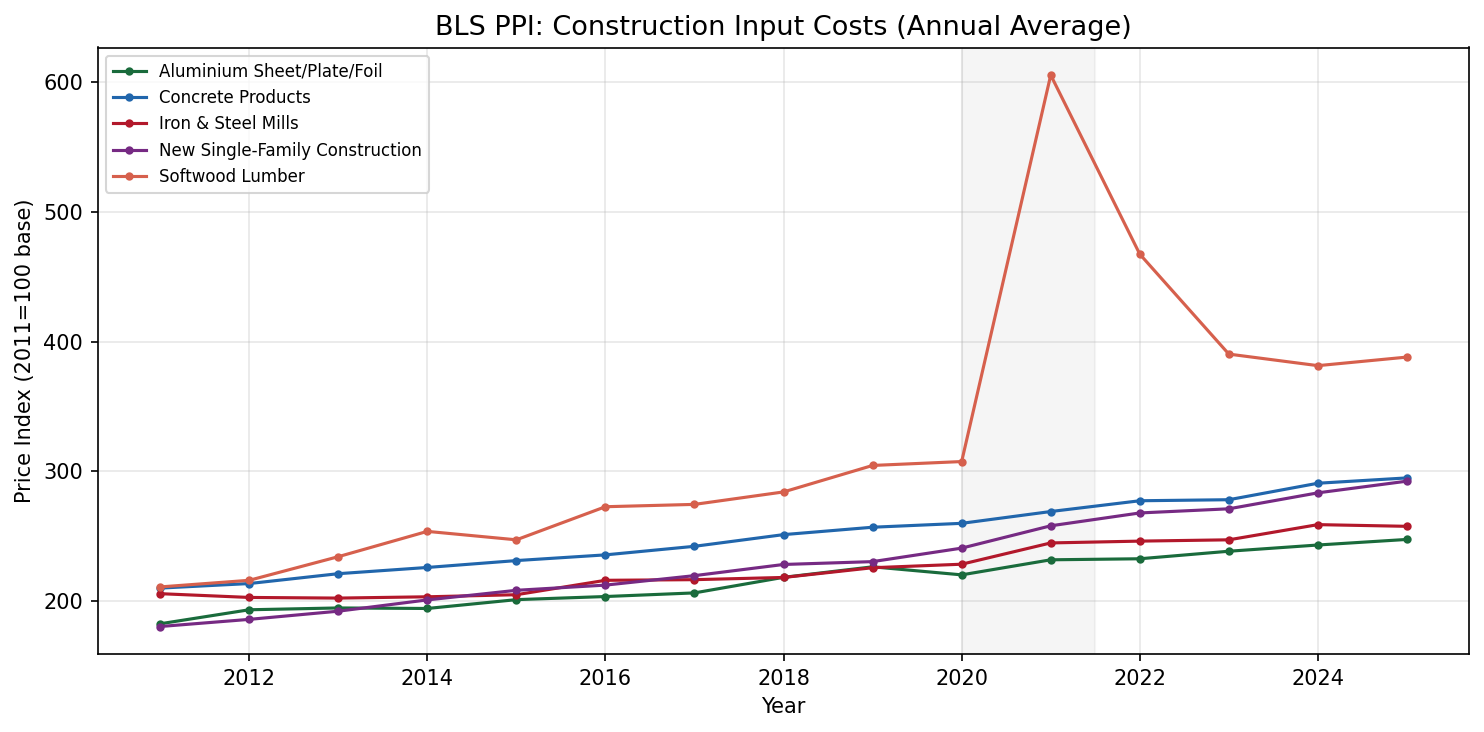
Rising housing costs are not driven solely by demand. Supply-side constraints — including escalating construction input costs, labor wage growth, and permit bottlenecks — play a critical structural role.
BLS Producer Price Index: Construction Inputs
The chart below tracks key BLS PPI series for construction-related inputs (lumber, concrete, steel, labor) from 2010 to the most recent available month. Rapid PPI increases translate directly into higher per-unit development costs.
QCEW Construction Wages by County
Average weekly wages for construction workers (NAICS 23) from the Quarterly Census of Employment and Wages (QCEW) reflect the labor cost component of new development.
Average Annual Construction Wages by County
This map shows average annual wages for construction workers (NAICS 23) by Colorado county using QCEW data. Higher wages in the Front Range and resort counties reflect both market rates and union density.
Building Permits Per Capita
The Census Building Permits Survey (BPS) tracks authorized new residential units at the county and place level. Permits per capita is a proxy for supply responsiveness — counties with low permit rates relative to population growth face the sharpest affordability stress.
Residential Building Permits Per Capita by County
Permits per capita measures how quickly each county is adding new housing relative to its population. Counties with low permit rates and high demand typically show the strongest rent growth.
What Best Predicts Home-Price Growth? A driver-ranking model across all 64 Colorado counties
Across Colorado's 64 counties, home prices have grown at very different rates over the past decade. Which county-level factors best explain the gap between counties that boomed and counties that stayed flat? We test five candidates — income growth, current vacancy rate, share of renters paying ≥30% of income on housing, building permits per capita, and average construction wages — and let a statistical model (ElasticNetCV) rank them by predictive weight. The model is built to handle messy real-world data: when two predictors move together (income growth and construction wages, for example), it splits the credit cleanly instead of arbitrarily picking one; and it re-checks itself on rotating subsets of counties so the ranking generalizes rather than memorizing patterns in any one set.
Want the technical detail or wondering what "ElasticNetCV" actually means? Expand the plain-English explainer below ↓ or hover the ? icon next to the heading.
🧠 What is an ElasticNetCV model? (plain English)
The question we're asking: across Colorado's 64 counties, which housing inputs best predict how much home prices have grown over the past decade?
We feed the model five candidate drivers per county — income growth, permit issuance, construction wages, vacancy rate, and rent burden — and let it figure out which ones actually matter for explaining the 10-year FHFA House Price Index change. The model produces a ranked list of standardized coefficients: a number for each driver where bigger means stronger predictive weight, and the sign tells you direction (positive = HPI grew faster when that driver was higher).
- "ElasticNet" = a penalty rule that shrinks weak predictors toward zero. So if vacancy rate doesn't really help explain HPI growth, the model will set its weight to nearly zero rather than pretending it matters. This is how it avoids overfitting and handles correlated inputs (income growth and construction wages tend to move together — the elastic-net penalty splits the credit cleanly).
- "CV" = cross-validation. Instead of fitting once and trusting the answer, the model re-fits itself on rotating subsets of counties (5-fold here) and keeps the version that generalizes best. This guards against the model just memorizing patterns specific to the 52–58 counties with complete data.
- "α via LOOCV MSE" = the strength of the shrinkage penalty is tuned by leaving one county out at a time, re-fitting, and picking the penalty value that minimizes total prediction error. Sounds fancy; in practice it just means "let the data pick the dial."
How to read the ranking table below: the top row is the strongest predictor, the magnitude is on a unit-free scale (so you can compare apples to apples), and the sign matters — positive coefficient = "more of this driver, more HPI growth," negative = "more of this driver, less HPI growth." For example, vacancy rate having a negative coefficient means tighter markets (lower vacancy) saw stronger appreciation, which matches how housing markets actually behave.
What this is NOT: a forecast. The model describes relationships across counties in a specific 10-year window — it doesn't predict next quarter's HPI. Use the ranking to understand which structural factors associate with appreciation pressure, not as a market-timing tool.
Model Specification (plain English)
- What we're predicting
- How much home prices grew (or shrank) in each Colorado county over the past 10 years, measured by the FHFA House Price Index. Higher number = faster appreciation.
- What inputs we test
- Five county-level housing-market signals, each from a public source:
- Income growth (last 10 years) — from the Census ACS. Are wages keeping up?
- Current vacancy rate (2024) — from ACS. Tight market or loose market?
- Rent burden ≥30% (2024) — from ACS. What share of renters are stretched?
- Building permits per capita (5-year average) — from Census Building Permits Survey. How fast is the county adding housing?
- Average annual construction wages (latest) — from BLS QCEW. What does it cost to build here?
- How the model is fit
- ElasticNetCV with 5-fold cross-validation. In plain terms: the algorithm tries many possible weightings of the five inputs, throws out the ones that don't generalize when tested on counties it hasn't seen yet, and reports the weighting that best explains HPI growth across the held-out counties. The penalty strength (α) is tuned by leaving one county out, refitting, and picking the value that produces the smallest prediction error.
- Which counties are included
- All counties with non-missing values for every input. In practice this is 52–58 of Colorado's 64 counties — the smallest rural counties are dropped when FHFA HPI or BLS QCEW suppresses their figures due to disclosure rules. The dropped counties are listed in the pipeline log.
Technical spec for reproducibility: Target = FHFA HPI 10-year % change. Features = ACS B19013 (income growth), ACS B25002 (vacancy), ACS B25070 (rent burden), Census BPS (permits/capita), BLS QCEW NAICS 23 (wages). Method = sklearn.linear_model.ElasticNetCV(cv=5) with α selected via leave-one-out MSE minimization. Inputs are z-score standardized before fitting.
The ranked feature importance table is exported to assets/co-housing-costs/snapshots/drivers_ranking.csv and reproduced below (regenerated monthly).
| Rank | Feature | Coefficient | Source |
|---|---|---|---|
| Loading driver ranking from latest pipeline run… | |||
Coefficients are standardized (z-score inputs). Magnitude reflects relative importance; sign reflects direction of the relationship to 10-year HPI change.
Methodology Notes
ACS Window Definitions
We use non-overlapping ACS 5-year survey cohorts to compute change over time:
- 2024 cohort: 2020–2024 (latest published 5-year estimates)
- 2014 cohort: 2010–2014 (10-year baseline)
- 2009 cohort: 2005–2009 (15-year baseline)
- Change formula: (endpoint estimate / baseline estimate) − 1
Non-overlapping windows avoid double-counting survey years and provide cleaner before/after comparisons. Overlapping 5-year windows (e.g., 2014–2018 vs. 2019–2023) share up to 4 survey years and can obscure true point-in-time changes.
FHFA HPI
The Federal Housing Finance Agency All-Transactions House Price Index is a repeat-sales index covering all owner-occupied properties with conforming mortgages. County-level data is available for Colorado counties meeting minimum transaction thresholds. Not all 64 counties have FHFA data; counties below the threshold are excluded from HPI-based analysis.
BLS PPI Series Used
- WPUFD4111: Construction materials (nonresidential building)
- WPUIP231120: Net inputs to multifamily residential construction
- PCU331110331110: Iron and steel mills
- PCU331315331315: Aluminium sheet/plate/foil
- PCU327310327310: Ready-mix concrete
QCEW Construction Wages
BLS Quarterly Census of Employment and Wages (QCEW) provides county-level employment and wage data by NAICS code. We use NAICS 23 (Construction) for the most recent four-quarter average annual wage. Counties with fewer than three establishments may have suppressed data per BLS disclosure avoidance policies.
Census Building Permits Survey
The Census BPS reports monthly permit authorizations by county and place. We aggregate to annual totals and compute a 5-year rolling average permits per capita using ACS population estimates for the denominator.
Related Articles
Data Sources & Methodology
- U.S. Census Bureau — American Community Survey (ACS) 5-Year Estimates — Median gross rent (B25064), median household income (B19013), vacancy rate (B25002), rent burden (B25070) · census.gov/acs
- Federal Housing Finance Agency (FHFA) — All-Transactions House Price Index — County-level repeat-sales HPI; annual frequency · fhfa.gov/data/hpi
- U.S. Bureau of Labor Statistics — Producer Price Index (PPI) — Construction input commodity series · bls.gov/ppi
- U.S. Bureau of Labor Statistics — Quarterly Census of Employment and Wages (QCEW) — County-level construction wages, NAICS 23 · bls.gov/cew
- U.S. Census Bureau — Building Permits Survey (BPS) — Monthly residential permit authorizations by county · census.gov/construction/bps
Disclaimer: All data represent published public-sector estimates and are subject to revision. ACS estimates carry margins of error; county-level figures for small-population counties should be interpreted with caution. This analysis is for informational purposes only and does not constitute investment, legal, or financial advice.